| moving average plot of Activating mutations | |
| moving average plot of Activating mutations without EGFR | |
| current mutation | |
| Hypermutated Segments |
Marked in green is the current mutation location in the central moving average plot of the normalized frequencies of activating mutations in human kinases using EGFR_HUMAN as the reference sequence.
First, a multiple sequence alignment for the tyrosine kinase domain was obtained from Pfam and additional refinements were done using Muscle. All mutations were then mapped onto the MSA as can be seen here
Second, we computationally calculated a relative frequency for each mutation by dividing the number of samples carrying the mutation by the total number of samples where the corresponding gene has been sequenced (according to COSMIC) and then multiplying the resulting figure by 1,000. The graph below was constructed using the relative frequency of all mutations. For each position of the MSA an accumulated relative frequency was computed by adding the individual relative frequencies of all activating mutations in all human kinases affecting that column of the alignment and a normalized frequency of activating mutations per column was obtained using the formula:

Normalized frequencies were used to calculate central moving averages with a window size of n=13. Values per position of the moving average window are plotted below.
 |  |
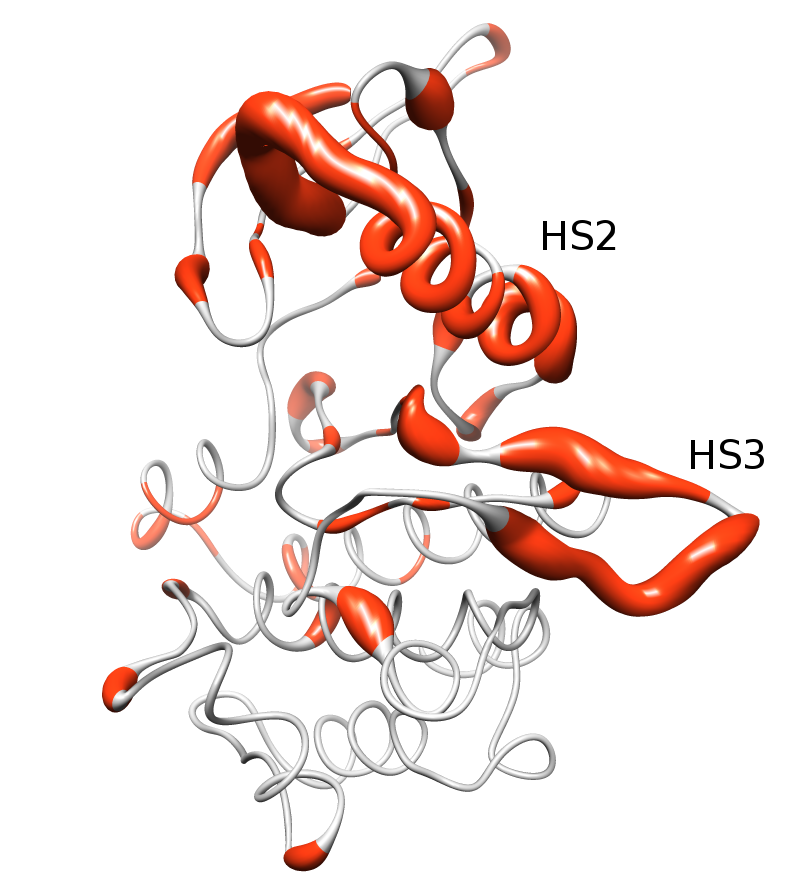
Activating mutations cluster in two hypermutated segments of the kinase domain. The image above show the distribution of mutations in the kinase domain of Tyrosin Kinases, depicted in the ribbon representation of the human EGFR structure (pdb code 1M14). Mutated positions are shown in orange, and the diameter of the ribbon is proportional to the normalized frequency of mutations affecting each position.
For more information, please refer to Molina-Vila et al, 2014
| PDB id | Description | Resolution | SPACI Score |
| 3POZ_A | egfr kinase domain complexed with tak-285 | 1.5 | 0.598043 |
| 2RGP_A | structure of egfr in complex with hydrazone, a potent dual inhibitor | 2 | 0.398807 |
| 3VJN_A | crystal structure of the mutated egfr kinase domain (g719s/t complex with amppnp. | 2.34 | 0.357415 |
| 1XKK_A | egfr kinase domain complexed with a quinazoline inhibitor- gw572016 | 2.4 | 0.349657 |
| 3BEL_A | x-ray structure of egfr in complex with oxime inhibitor | 2.3 | 0.334124 |
| 3UG2_A | crystal structure of the mutated egfr kinase domain (g719s/t complex with gefitinib | 2.5 | 0.32858 |
| 2EB2_A | crystal structure of mutated egfr kinase domain (g719s) | 2.5 | 0.326237 |
| 2ITV_A | crystal structure of egfr kinase domain l858r mutation in complex with amp-pnp | 2.47 | 0.319794 |
| 2ITN_A | crystal structure of egfr kinase domain g719s mutation in complex with amp-pnp | 2.47 | 0.319681 |
| 3VJO_A | crystal structure of the wild-type egfr kinase domain in com amppnp. | 2.64 | 0.304627 |