Kin-driver can be searched using the tabs at the left menu in the Home page:
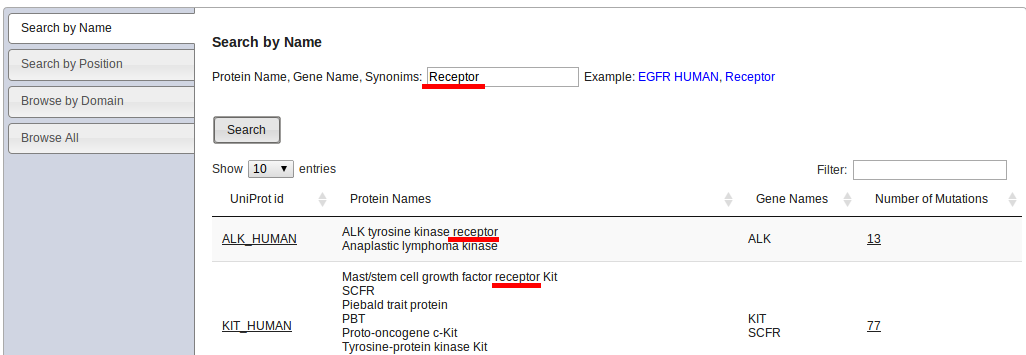
This type of search admits UniProt names, gene names or keywords. It will look up for a match of the input keyword in the UniProt fields corresponding to protein names, gene names and ids. In the example below, the keyword "receptor" was used and the first to matches are shown. If more than word is used, the search algorithm will look for all the words to appear together in at least one field.
The result is a list of UniProt IDs, where the last column of the table indicates how many mutations are in Kin-Driver for that protein.
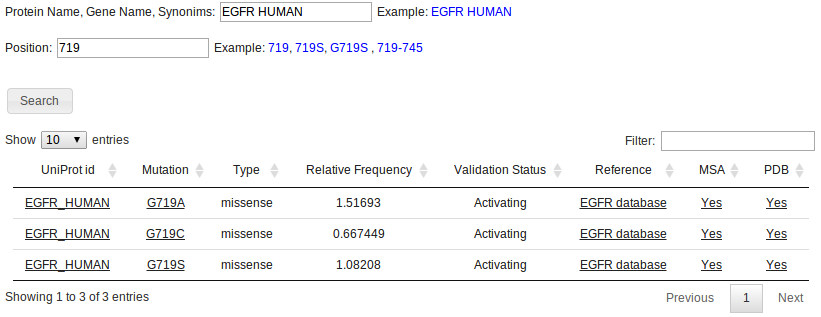
To look for specific mutated positions, use the "Search by Position" option. Different search combinations can be used such as a specific mutation or position (eg, 719 or G719S), or a range of positions (eg 719-745).
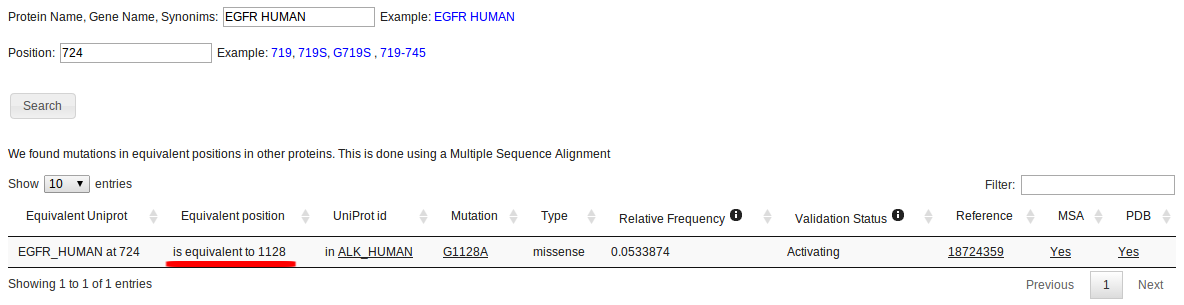
If no matches are found, the algorithm will look for equivalente mutations in a Multiple Sequence Alignment (MSA). This is done by looking at the columns of the MSA that correspond to the searched positions in the specified protein. If any mutation is found in those columns for other proteins, they will be reported as equivalent mutations. This is exemplified below, in the MSA section
In this case, position 724 for EGFR_HUMAN yields no results, but an equivalent mutated position is found in ALK_HUMAN, correponding to the G1128A mutation.
In Kin-Driver, proteins are classified in two domains: Tyrosine Kinases and Serine/Threonine Kinases. Each has its own Multiple Sequence Alignment and features. Choosing to Browse by Domain will display all proteins and mutations in one of the domains.
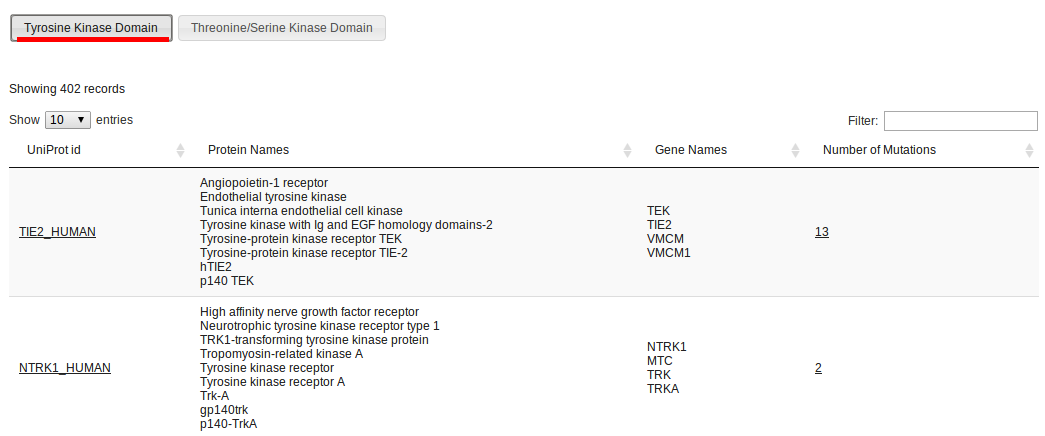
This option will display all proteins that have been annotated with mutations in Kin-Driver.
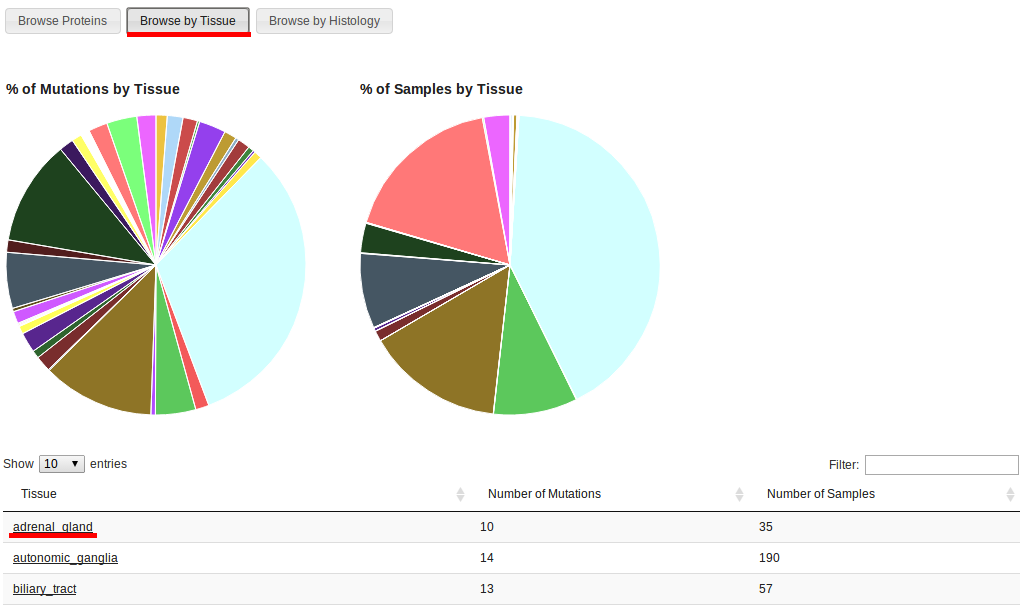
Browsing by tissue displays the tissue types that correspond to COSMIC samples with driver mutations. The first pie chart (left) shows the proportion of driver mutations by tissue type, while the chart on the right shows the proportion of COSMIC samples with driver mutations by tissue.
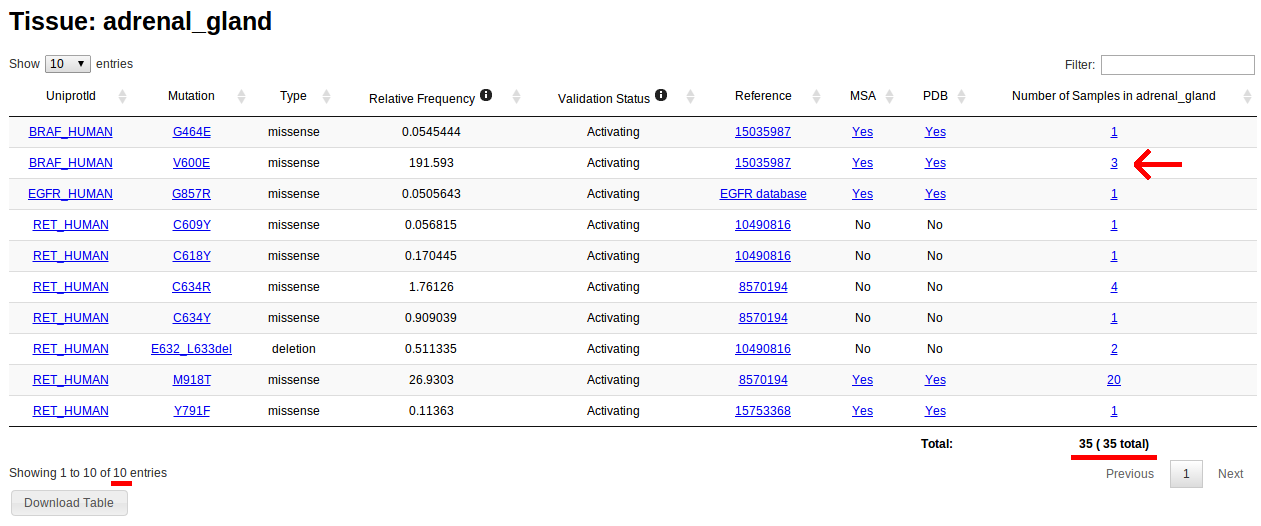
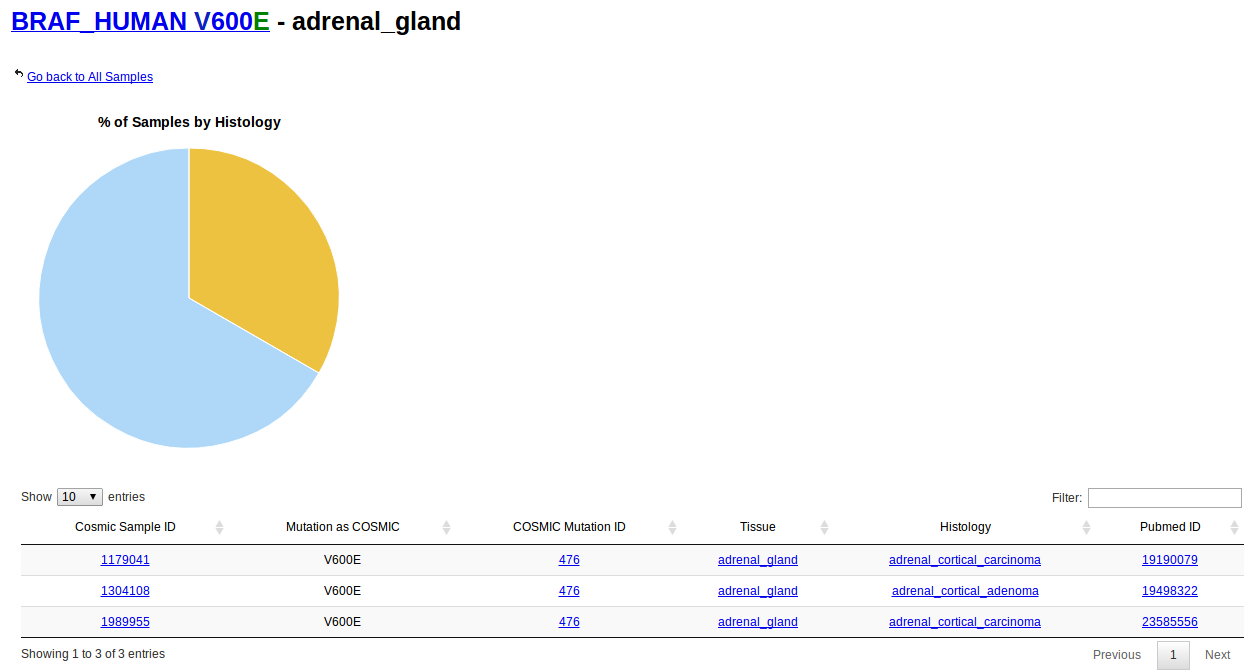
Notice that, for example, tissue type "Adrenal gland" has 10 driver mutations in 35 samples. Clicking on the link will display a table with information about those 10 driver mutations, like mutation sintax and protein name. The number of samples correspond for that mutation in that protein in the specified tissue
Browsing by histology is analogous to browsing by tissue. In this case, all types of histological types are listed instead of primary tissues. These types are directly obtained from COSMIC samples. For more information on the classification of tumour types please visit the COSMIC help page
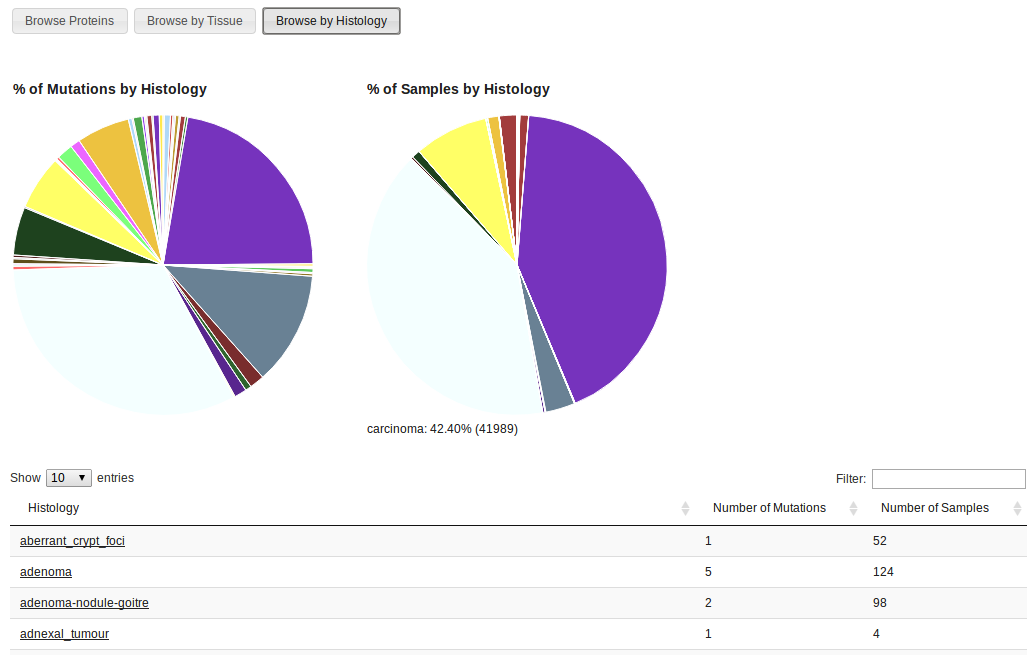
For each protein listed in Kin-Driver there is a table containing all driver mutations. First, the domain architecture for the protein is shown. This information is obtained from the latest Pfam release. The table lists all mutations, and for each of them there you can find:
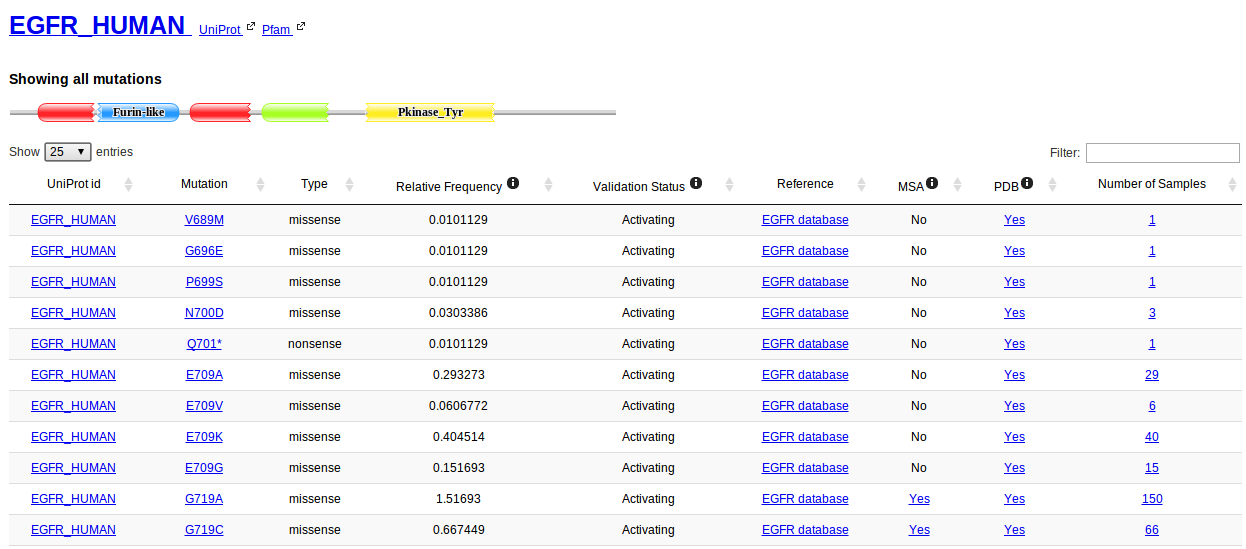
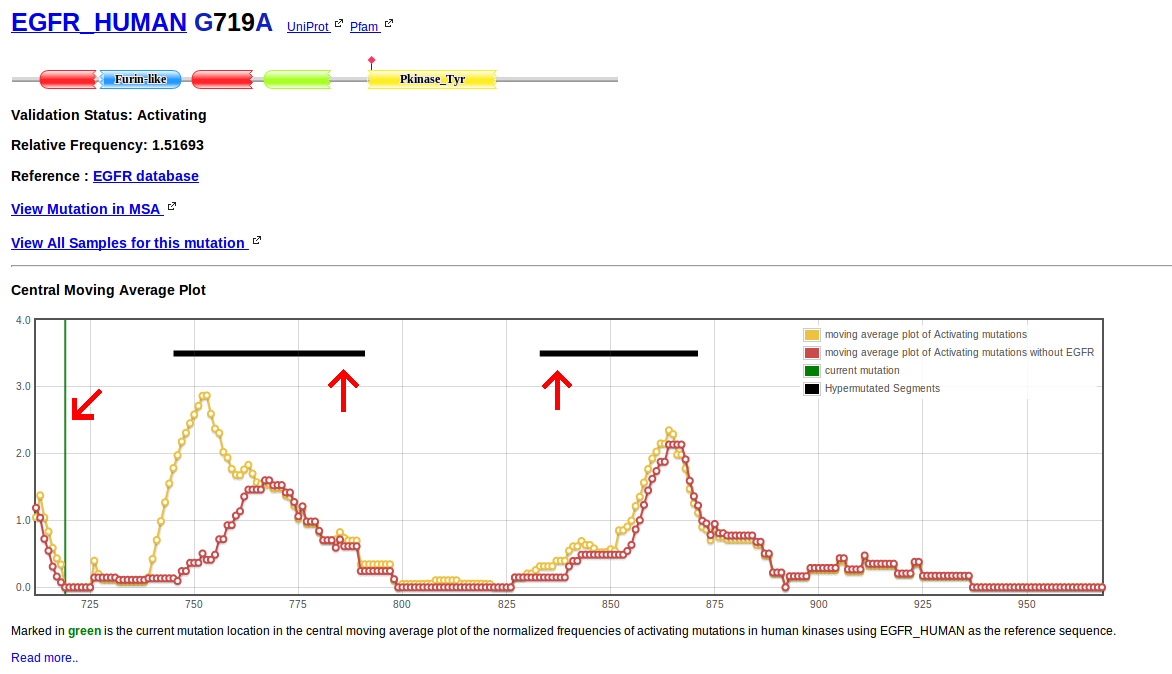
When a particular mutation is selected the architecture diagram shows the location of the current mutation with a red diamond. Links are provided to check all samples for the mutation and to check the mutation in the MSA context.
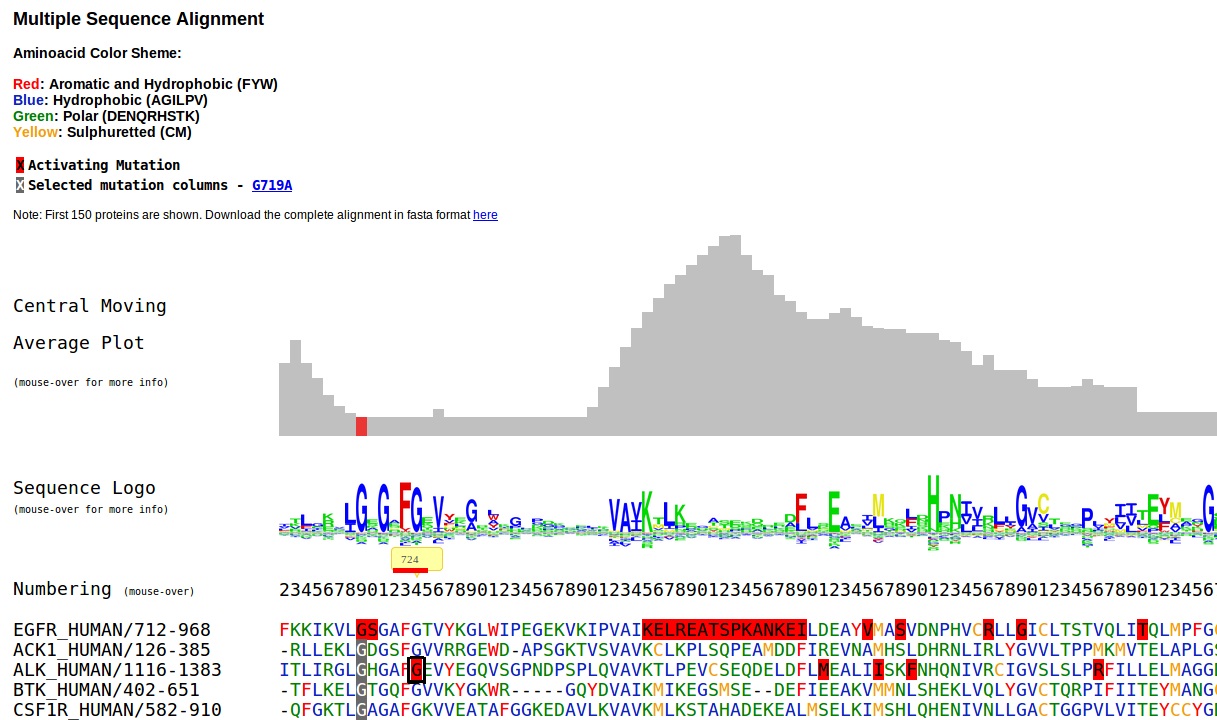
Then a Central Moving Average Plot (CMA Plot) is displayed. It is constructed using the relative frequency of all mutations. For each position of the MSA an accumulated relative frequency was computed by adding the individual relative frequencies of all activating mutations in all human kinases affecting that column of the alignment and a normalized frequency of activating mutations per column was obtained using the formula:

Normalized frequencies are then used to calculate central moving averages with a window size of n=13. Values per position of the moving average window are then plotted.
Vertical green lines indicate the position of the current mutation in the CMA Plot.
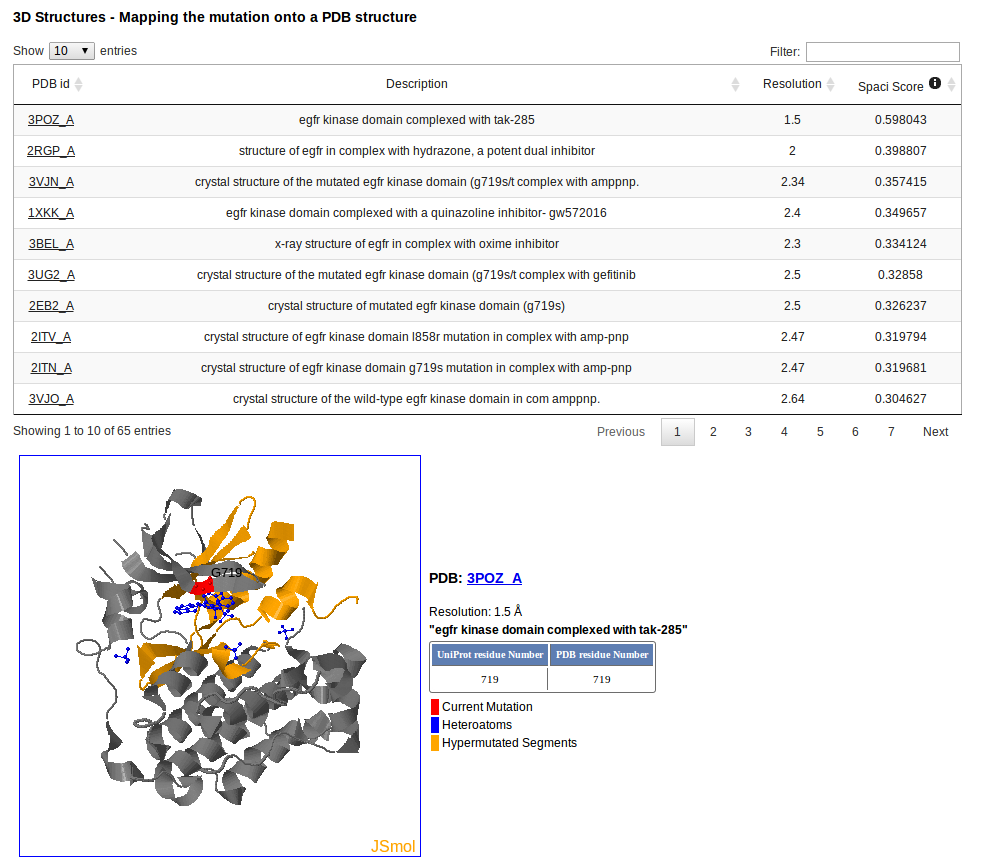
In case is available, a PDB structure can be selected to display the position of the mutation in the 3D structure. A PDB can be selected based on its crystallographic resolution or its Spaci Score. The Spaci Score is a numeric score that provides some insight into the reliability and precision of a crystallographically-determined structure in a PDB file.
Structures with SPACI scores greater than 0.4 are generally quite good. For more information take a look here.
The mutation is mapped onto the structure in red, and Hypermutated Segments are shown in yellow. The table at the right of the PDB structure maps the UniProt Numbering with the PDB Numbering.
Multiple sequence alignments were obtained from Pfam. When a mutation is selected to be visualized in the MSA, the mutated protein (the reference protein) is placed on top of the MSA. Columns with gaps in the reference protein are removed. Aminoacid color scheme is based on residue hydrophobicity and composition.
The selected mutation columns are displayed in gray background. Driver mutations in other proteins are shown in red bakground. Placing your mouse over any mutation will open a tip with links associated to driver mutations in that positions